

SBTi Corporate Net-Zero Standard Version 2.0
The Science Based Targets initiative has released its Corporate Net-Zero Standard Version 2.0, marking a clear evolution in how corporate climate action is structured and assessed.
While the foundation remains unchanged, deep emissions reductions across Scopes 1, 2 and 3 remain the priority, the new standard introduces important refinements in how companies are expected to implement, report and take responsibility for their emissions.
More importantly, it provides a clearer signal on the future role of carbon credits and removals in corporate net-zero strategies.
A shift from ambition-setting to implementation accountability
One of the most significant changes is the increased focus on implementation.
Companies are now expected to explicitly connect their science-based targets to real operational decisions, including transition planning, procurement strategies and investment cycles.
The standard introduces a “best-efforts” principle, requiring companies to use all reasonable levers within their control, disclose constraints and dependencies, and explain how barriers are being addressed.
Clearer structure across Scopes 1, 2 and 3
The updated framework requires a more structured approach:
- Scope 1 and Scope 2 must now be addressed separately, with full coverage required
- Scope 1 reductions may follow multiple pathways (absolute, intensity-based or transition-based)
- Scope 2 requirements are strengthened, particularly around low-carbon electricity sourcing
Scope 3 is maintained as the most flexible but critical component, with companies required to prioritise material emissions sources and integrate them into targets or transition plans.
Carbon credits remain excluded from target achievement
Carbon credits cannot be used to:
- reduce reported emissions
- demonstrate progress toward targets
- substitute operational decarbonisation
Even where companies miss targets, SBTi only recommends voluntary purchase of removals as an additional action, without allowing them to count toward target achievement.
Ongoing Emissions Responsibility (OER)
The new OER framework introduces voluntary recognition for companies contributing to climate action beyond their own value chain emissions.
Three levels exist:
- Engaged (≥1%)
- Advanced (≥10% incl. Scope 1 & 2)
- Leadership (full Scope 1–3 coverage with financial contribution requirement)
Companies may use either verified mitigation outcomes or a financial contribution mechanism.
Post-2035 removal trajectory
From 2035 onwards, companies are expected to support removals equal to:
- at least 1% of ongoing emissions
- increasing linearly to 100% by net zero (2050 latest)
A key distinction is introduced:
- long-lived greenhouse gases → long-lived removals
- other emissions → short- or long-lived removals
This creates a structural shift toward durability-based carbon accounting
10% long-lived removals requirement
From 2035, at least 10% of covered emissions linked to long-lived greenhouse gases must be addressed with long-lived removals.
This share increases progressively to 100% by the net-zero year.
This reinforces a clear market signal toward durable carbon storage solutions.
No reliance on a single credit quality standard
The framework does not anchor eligibility to specific labels such as CCP.
Instead, it relies on principle-based integrity criteria:
additionality, permanence, leakage control, MRV robustness, and safeguards.
Corresponding adjustments and Article 6
SBTi recommends that companies prioritise credits not simultaneously claimed under national NDCs.
Where possible, companies are encouraged to use credits backed by corresponding adjustments under Article 6, improving the integrity of net-zero claims and reducing double counting risk.
What this means for corporate carbon strategies
Three structural shifts stand out:
- From target-setting to implementation accountability
- From offsetting logic to strict separation of roles
- From generic credits to durability-based carbon removal strategies
Conclusion
SBTi V2.0 does not fundamentally change the direction of corporate climate ambition. It clarifies how it must be implemented.
Net zero is no longer only a target framework. It is becoming an operational responsibility framework, combining emissions reduction with structured climate contribution.
Sources
- Science Based Targets initiative (2026), Corporate Net-Zero Standard Version 2.0
- Science Based Targets initiative (2026), Introducing the SBTi Corporate Net-Zero Standard Version 2.0
- Science Based Targets initiative (2026), SBTi Corporate Net-Zero Standard V2.0 – Guidance and supporting documents
- Science Based Targets initiative (2026), Net-Zero Standard implementation materials and FAQs
- United Nations Framework Convention on Climate Change (UNFCCC), Article 6 of the Paris Agreement – Corresponding Adjustments Guidance

CORSIA: Navigating the Future of Aviation Emissions
CORSIA, the Carbon Offsetting and Reduction Scheme for International Aviation, is an ambitious market-based initiative spearheaded by the International Civil Aviation Organization (ICAO) to address the environmental impact of aviation.
Established in 2016, CORSIA aims for carbon-neutral growth in international aviation from 2020 onward by driving airlines emissions reduction through operational efficiencies and adoption sustainable aviation fuels (SAF). Carbon offsetting will play a crucial role as airlines residual emissions above the baseline will need to be addressed through the purchase of eligible carbon credits.
Phases of Implementation
CORSIA is being implemented in three phases:
Pilot Phase (2021-2023)
- Participation is voluntary.
- Airlines report emissions but are not required to offset them during this period.
- Carbon standards like GS, VCS, and ACR are conditionally approved, but actual usage depends on compliance with specific criteria.
First Phase (2024-2026)
- Also voluntary, but airlines operating flights between ICAO Participating States must offset emissions that exceed 85% of their 2019 levels by purchasing carbon credits.
- Approved standards include ART and ACR, while others like GS and VCS are conditionally approved pending further adjustments.
- Airlines must source credits with « Corresponding Adjustments » (CA) ensuring that the emissions reductions are not double-counted by the host country of the offset project and the purchasing airline.
Second Phase (2027-2035)
- Participation becomes mandatory for most ICAO member states.
- The requirements for emission offsets are expected to be more stringent, reflecting the global push towards more aggressive climate action.
Compliance and Reporting
Airlines are required to monitor, report, and verify (MRV) their emissions annually. However, airlines have until January 0228 to purchase the necessary carbon credits to meet their requirements. This delay allows airlines to accumulate the necessary offsets without immediate financial pressure. The final deadline for offsetting 2024-2026 emissions is January 2028.
Market Dynamics and Challenges
The market for CORSIA-eligible offsets is still developing. Currently, only a limited number of projects, like the one managed by the government of Guyana under the ART Trees standard, are issuing eligible credits for Phase 1 (7.1MtCO2e, but not solely intended to be used under CORSIA). This has led to uncertainty regarding the true market value of these offsets due to the limited supply. By 2025, other standards like GS and VCS are expected to be fully compliant and approved, potentially increasing the available supply of offsets significantly.
Future Projections
The demand for carbon credits is projected to increase substantially during the mandatory phase from 2027 to 2035. Estimates from AlliedOffsets and IETA report, suggest that the demand could range between 50 to 230 million credits for 2024-2026 Phase 1, with an expected undersupply of 34 million credits. This undersupply is contingent on the fact that there are no changes in ICAO approvals and new Letter of Approvals given by countries allowing credits to be Correspondingly Adjusted.
Conclusion
CORSIA is expected to drive a significant increase in demand for carbon credits, providing a robust incentive for further development and verification of high-quality carbon offset projects. This program represents a critical step towards achieving a more sustainable aviation industry. While the initial phases allow for a gradual build-up of compliance mechanisms and market responses, the mandatory phase from 2027 will mark a significant shift towards rigorous climate action in aviation. The successful implementation of CORSIA will depend on the continued collaboration between airlines, carbon standards, and national governments to ensure the integrity and transparency of carbon offsets.

High-integrity Plastic credits and the UN Plastics Treaty
Overview of the UN Plastics Treaty Negotiation
The 5th and last phase of negotiations for a UN Plastics Treaty has started this week in Busan, Korea. High-integrity plastic credits are a powerful way to fight plastic pollution worldwide. If used constructively, it could provide massive private funding to plastic waste collection and recycling projects in places where it is urgently required. This mechanism should be valued in the Treaty as a complementary approach to Extended Producer Responsibility (EPR) frameworks, enabling short-term action and initiating a “Just Transition” for the informal waste sector.
Plastic pollution: the size of the problem
Plastic production is set to triple by 2060 if no production cap is implemented in the last phase of negotiation for a UN Plastics Treaty taking place this week in Busan. Most of this production growth will occur in emerging countries that are lacking waste management infrastructures. While emerging markets are hotspots of plastic pollution, they only receive 6% of investments (US$ 11 billion out of the US$ 190 billion invested into plastics circularity since 2018). Africa received only 0.3% of total investments in 2023, despite 8% of plastic waste leaked to the ocean coming from the continent. Macroeconomic costs of stringent policy implementation are also higher in emerging countries: below 0.5% of GDP for OECD countries, and around 1.5% of GDP for Sub-Saharan African countries.
This is even more problematic because the true cost of plastics is eight times higher in emerging countries when accounting for its negative externalities. The current investment trajectory is too slow to meet targets to reduce plastic leakage into the environment by 90% by 2040. All funding sources must be mobilized to help emerging countries fighting the plastic pollution timebomb.
Plastic credits: a verifiable tool for impact investing at scale
One plastic credit is equal to one tone of plastic waste removed from the environment, or recycled. Plastic collection or recycling projects can get certified by well-known standards such as the Verra Plastic Waste Reduction Program or Ocean-Bound Plastic through an independent third-party audit. Plastic credits generated are then sold to companies willing to voluntary contribute to the fight against plastic pollution by enhancing plastic circularity. Plastic credits bring funding to impact projects, enhancing transparency and social justice from plastic waste management activities.
Not a license to pollute but an incentivization to act & contribute
If integrated into broader corporate plastic mitigation roadmaps, plastic credits could impact project finance at scale, while propelling corporate ambitious roadmaps. Under no circumstances should this prevent us from limiting production or turning a blind eye to value chain actions. This a complementary and necessary solution to anticipate the ticking plastic pollution timebomb.
Companies should adopt a contributory – but quantified and transparent – approach to engage into global plastic waste mitigation roadmaps encompassing plastic footprint measurement (Plastic Footprint Network, WBCSD), reduction targets (3R Initiative, Global Commitment), credit purchase (Verra, OBP) and reporting (Carbon Disclosure Project, CSRD).
Not all standards are equal
Various private-owned plastic credit standards have been developed in recent years. We should only support high-integrity plastic credits corresponding to “fully independent and transparent programs” identified as “Tier 1” in a recent World Bank report. Those credits follow key market principles that are essential to create an investment instrument beneficial to anyone. Here are some of the most important ones:
- Additionality: proof that without the project, the plastic waste would have been left or dumped into the environment – or that the project would not have been feasible without plastic credit finance.
- Permanence: plastic waste must be brought to a more appropriate end-of-life such as recycling or upcycling, ensuring no leakage in the future. Waste-to-energy or proper landfills must be carefully managed and – when possible – avoided.
- Third-party audited & listed on a public registry for guaranteeing verifiability and transparency.
- Independency: standard setters must be fully independent from the selling activities for avoiding any possible conflicts of interest.
The necessity of blended finance to face the chicken & egg problem
The real power of voluntary environmental markets is to enable project finance. As an example, the maturity stage of the 15+ years old carbon market now allows for early-stage project finance. Removall is a leader of that type of investment, with 7 carbon projects financed globally. In most cases, 100% of investment needs are covered by carbon finance by anticipating the carbon credit potential of the project over the long-term. Even private banks are starting to invest in such projects, with IRR above industrial levels.
As the plastic credit market is still emerging, the demand for pre-purchase of credits by private companies is still low – which means that financing projects in the ramp-up phase remains difficult. We are currently facing a chicken & egg situation in which corporates are looking for up-and-running projects, while the latter require funding to become fully operational.
That is why blended finance mechanisms are essential to propel the plastic credit market. Few months ago, the World Bank has announced a US$ 100 million Plastic Waste Reduction-linked bond, similar to the “Rhino bond” issued in South Africa in 2022. With a risk hedged by their partner Citi Group, the first phase of the bond directly finances two projects Verra-certified in Ghana and Indonesia. This allows private investors to join in early stages by lowering the project risk. Such innovative finance mechanisms must be leveraged extensively in the years to come.
Plastic credits & EPR: joining the dots in the Treaty
Extended Producer Responsibility (EPR) frameworks can be an important policy approach to addressing plastic pollution if it is well-designed and implemented in a context-appropriate manner. It is strongly advocated in the Treaty, as the mechanism has brought some great successes in developed countries. Still there is a lack of locally appropriate examples that developing countries can learn from or replicate.
EPR implementation in emerging countries faces various challenges:
- Huge infrastructure funding deficit that governments are unable to bridge
- Resource-intensive for governments on the legal, regulatory, and administrative requirements
- Informal waste sector that first needs to be progressively formalized
- Lenghty implementation process, taking 10+ years in most cases (not to mention the risk of political corruption)
This is not about plastic credits vs. EPR frameworks, but rather about how to combine the two to get the most out of them. Links between compliance and voluntary environmental markets are worth studying. This has occurred frequently in the voluntary carbon market, with Article 6 of the Paris Agreement allowing countries to trade carbon credits as part of their Nationally Determined Contributions (NDCs), or through Article 147 of the French law ‘Climat & Résilience’ which obliges airline companies to offset their carbon emissions. Similar frameworks are under development for biodiversity credits, such as the Biodiversity Net Gain in the UK or the Nature Repair Market in Australia. Recognizing plastic credits as a means of complying with regulatory obligations could propel the market, avoiding losing decades of action.
Plastic credits under the Verra Plastic Waste Reduction Program have been designed as a temporary solution for EPR framework implementation in emerging countries. The crediting period is either 10 years or 7 years renewable twice (under updated conditions), for setting up the waste management system before handling it back to the government or including it into an established EPR scheme. Verra will publish a white paper dedicated to the topic in the coming weeks.
The need for a “Just Transition”
Social impacts for the waste picker community are at the heart of high-integrity plastic credit methodologies. Under the Verra Plastic Waste Reduction Program, various social safeguards are implemented:
- Consent: obtain free, prior and informed consent prior to project implementation
- Transparency: organize a Local Stakeholder Consultation for collecting feedback and establish suitable communication channels. Local communities should have the right to influence project design.
- Safety: provide PPE equipment and enhance safety trainings
- Labor rights: prohibit child labour, provide wages above national levels and ID cards
Informal waste sector in emerging countries always implies huge social challenges. High-integrity plastic credit certification is a way to progressively start its formalization, anticipating any government-led EPR mechanism. Additional standards such as the OBP Social+ allow for the certification of social co-benefits. Other independent frameworks provide detailed guidelines, such as the Harmonized Responsible Sourcing framework by the Circulate Initiative.
What would the ideal Plastics Treaty look like?
The 5th and last phase of negotiations for a UN Plastics Treaty has started this week in Busan, Korea. Chances of success are low: ambitious options mentioned in the draft Treaty last summer have been withdrawn in the shorter version “Non-paper 3” drafted by the Chair of Committee. Some key challenges are not yet resolved, such as limiting plastic production worldwide or agreeing on rules of procedures (consensus vs. vote), which threatens even the existence of the Treaty.
Still, there is place for hope. The Paris Agreement has been signed in the last phase of negotiations at COP21, and it has now become the main reference of climate action. This is what an ambitious Plastics Treaty could look like in an ideal world:
- Plastic production cap on a global scale
- Plastic disclosure frameworks for the private sector: plastic footprint, target-setting, mitigation actions & reporting
- International plastic pollution fee, channelling funds towards emerging countries through an international organization such as the Global Environmental Facility
- High-integrity plastic credits incentivized and established regulatory links with EPR in emerging countries.
Let’s be clear: this will take time. Even if the 5th round of negotiation comes to an agreement, the Treaty will still have to be approved by a Diplomatic Conference before entering the COP process. We are running out of time: with high-integrity plastic credits, we can start to act now.
Sources
- wwf-brief-oeeg1-aug-2024—eng.pdf
- Insights into Global Plastics Circularity Investments
- WWF REPORT: Who pays for plastic pollution? | WWF
- Towards Ending Plastic Pollution
- Unlocking Financing to Combat the Plastics Crisis – Opportunities, Risks, and Recommendations for Plastic Credits
- World Bank’s New Outcome Bond Helps Communities Remove and Recycle Plastic Waste
- Verra at Fifth Session of Global Plastic Treaty Negotiations (INC-5) – Verra
- Executive Summary_Plastic Credits and Extended Producer Responsibility.indd
- giz2024-en-just-transition-report_UPDATE-3
- Harmonized Responsible Sourcing Framework for Recycled Plastics
- Systemiq-A_Living_Income_for_the_Informal_Waste_Sector_EN

Navigating the New Normal: Demystifying the Latest SBTi Updates for Businesses
Introduction
The Science- Based Targets initiative (SBTi), established in 2015, provides a framework for businesses willing to align greenhouse gas (GHG) reduction goals with scientifically validated pathways to limit global warming. Almost 11 000 businesses have confirmed SBTi targets or commitments today. Initially, SBTi guidelines aligned broadly with the Paris Agreement’s 2°C limit. However, as evolving scientific evidence emphasized the critical need for more ambitious climate action, subsequent updates steered targets closer to the more ambitious 1.5°C threshold.
The SBTi is currently revising its framework, with significant proposed updates to its Corporate Net-Zero Standard and associated guidance. These forthcoming changes aim at codifying a clearer, more robust framework for climate-aligned corporate action, requiring near, and long-term targets in line with the 1.5°C scenario. For businesses serious about achieving net-zero and meeting rising stakeholder expectations, understanding these latest developments and their implications is critical.
Why SBTi Updates Were Needed
SBTi 1.0 played a pioneering role, offering businesses a way to legitimize their climate ambition. Yet, it fell short in two areas: detailed oversight of Scope 3 emissions (which make up the bulk of many companies’ footprints), and clarity around the appropriate role of carbon offsets and removals. As scrutiny over corporate greenwashing intensified and climate impacts accelerated, a more granular and enforceable framework was required.
SBTi’s new proposed framework includes stricter target-setting rules, public accountability mechanisms, and, for the first time-specific guidance on how companies should integrate high-integrity carbon removals, including durability thresholds and separate claims frameworks.
What’s Actually New in the Latest SBTi Guidance?
The latest SBTi updates significantly raise expectations:
1 - Adressing Scope 1 Residual Emissions : 2 options are included in this draft, including:
– A requirement for companies to set removal targets, including interim milestones, to address the impact of residual emissions; Optional recognition for companies that set removal targets, including interim milestones, to address the impact of residual emissions; or
– Flexibility to address expected residual emissions either entirely through emissions reductions, entirely through removals or through a combination of both.
2 - Adressing Scope 2 Emissions:
Requirement to set both a location-based target, and either a market-based or zero-carbon electricity target vs Requirement for location- or market-based targets, with the option of renewable electricity targets before
3 - Beyond Value Chain Mitigation:
Previous versions of this standard recommended that companies take responsibility for their ongoing emissions by mitigating emissions beyond their value chain. However, these efforts were not formally recognized. In this standard, optional recognition of companies that mitigate the impact of ongoing emissions and related reporting requirements are proposed. This change aims to provide a stronger incentive for companies to take responsibility for ongoing emissions, recognizing the urgent need to accelerate climate action and scale up corporate climate finance.
4 - Mandatory, Detailed Scope 3 Requirements:
The first key difference is that the draft standard requires all Category A companies (i.e., large and medium-sized companies in higher-income countries; see ‘company categorization’ in the draft standard for more information) to set targets against scope 3 targets, regardless of their share of a company’s total emissions. Setting scope 3 targets is an option for Category B companies (small companies and medium-sized companies in lower-income countries).
Supplier engagement is now a baseline expectation, emphasizing the importance of value chain decarbonization.
Role of Carbon Removals and Offsets: From Ambiguity to Strategy
The latest SBTi guidance brings clarity to the often, misunderstood role of carbon removals. Emissions avoidance and reductions remain the priority (typically requiring 90-95% abatement), but high-integrity removals now play a more precise role for residual emissions at the long-term net-zero target:
Within the Value Chain: Permanent carbon removals can be used for the residual emissions that cannot be fully abated to achieve net-zero by the long-term target year.
Beyond the Value Chain: While not counted toward target achievement, projects beyond a company’s operations (e.g., blue carbon or reforestation) are encouraged as voluntary contributions to global climate action and can deliver societal and environmental co-benefits.
Not all removals are considered equal. The SBTi sets a strong quality bar: projects must be additional, durable, measurable, and verifiable. This shift addresses long-standing criticisms of legacy offsetting strategies that failed to guarantee permanence or environmental integrity.
Sectors Facing the Biggest Implications
The SBTi’s sector-specific guidelines zero in on industries with the most complex and impactful emissions:
• Aviation: High fossil dependency means limited decarbonization options. SBTi calls for rapid shifts to sustainable aviation fuels, optimized flight operations, and credible removal investments.
• Construction: Embodied carbon from steel, cement, and building materials is now under the spotlight. Companies must pivot procurement strategies toward lower emission alternatives.
• Agriculture and Land Use: One of the most complex sectors, it faces new pressures to monitor land use change, fertilizer application, and livestock emissions, often through indirect control mechanisms.
• Cross-Sectoral Scope 3 Engagement: Across all industries, robust supplier engagement and data collection for Scope 3 emissions are now paramount, requiring companies to influence and support decarbonization efforts throughout their value chains.
For carbon project developers, this means rising demand for removal methodologies tied to these sectors, like agroforestry, soil carbon, or mineralization, especially the tech-based solutions capable of delivering Scope 3-aligned solutions to corporate clients.
Strategic Insights: SBTi as the Pillar of Net-Zero Integrity
Adopting the latest SBTi guidance offers companies more than just a badge, it’s a roadmap to resilient, future, proof operations. With over 4,200 companies (covering nearly 40% of global market capitalization) now participating in the SBTi, the framework has evolved into the de facto global standard for climate credibility. As the SBTi itself states, « Businesses report that adopting a science-based target: Boosts profitability, Improves investor confidence, Drives innovation, Reduces regulatory uncertainty, Strengthens brand reputation. »
Other frameworks like the ISO 14060-1 norm exist, ensuring that global guidelines are constantly challenged and updated to integrate the latest conception of best practices. Companies can choose the framework that will be most adapted to their ESG ambitions.
For latecomers, the risk isn’t just reputational, it’s regulatory. SBTi’s integration with initiatives like CDP, the ISSB, and the EU’s CSRD makes alignment a likely prerequisite for reporting and compliance.
Practical Recommendations for Businesses
• Gap Assessment: Review gaps between your current strategy and the latest SBTi expectations, particularly on Scope 3 coverage and removal timelines.
• Early Engagement of Suppliers: Develop procurement criteria and incentive programs that reward suppliers for decarbonization, fostering a collaborative approach to value chain emissions.
• Investment in Quality Removals: Avoid legacy offsets. Source high, quality carbon removals or build a pathway to ramp up durability for residual emissions.
• MRV Tools Integration: Ensure your reporting systems meet SBTi’s new standards for transparency and verification, enabling robust data collection and reliable claims.
How Removall Supports Your Transition
Removall helps companies navigate and implement the latest SBTi guidance with strategic depth:
• High-Integrity Carbon Removals: Our pipeline of projects includes nature-based and tech-based CDR projects aligned with SBTi permanence requirements, including biochar, agroforestry, and blue carbon solutions.
• Beyond Value Chain Contributions: We support companies in delivering biodiversity, water, and community co-benefits while enhancing brand and investor narratives.
• Reporting and communication: We support our clients with their reporting exercises to ensure transparency and help adopt best practice communication strategies to avoid mis claims and public exposure.
Conclusion: From Pledges to Proof
The latest SBTi updates represent a structural shift in how corporate climate leadership is measured. They empower serious businesses to move beyond symbolic pledges toward scientifically grounded, verifiable impact.
The next frontier lies in the execution: decarbonizing operations, transforming supply chains, and financing high-quality carbon removals. As pressure mounts, from regulators, stakeholders, and investors, companies that act now will be best placed to lead in the net-zero economy.
For carbon project developers, it opens the door to new demand, but only if integrity is embedded from day one.
The latest SBTi guidance is not the ceiling. It’s the new floor.
References
Ceezer. (n.d.). SBTi’s major shift opens door to carbon removal credits in corporate climate targets.
Climeworks. (n.d.). 5 things to know about the SBTi’s new carbon removal guideline.
Position Green. (2025, May 5). Aligning carbon accounting to SBTi: A practical guide for building credible net,zero pathways.
Pulsora. (2025, June 3). CDP guidance for companies reporting in 2025.
Science Based Targets initiative. (n.d.). Ambitious corporate climate action.
Science Based Targets initiative. (n.d.). Standards and guidance.
Science Based Targets initiative. (2021). The Net,Zero Standard.
Science Based Targets initiative. (2025, March). SBTi Corporate Net,Zero Standard Version 2.0: Initial Consultation Draft with Narrative.
Science Based Targets initiative. (2025, March). Draft Corporate Net,Zero Standard V2 Explained: Scopes 1, 2 and 3.
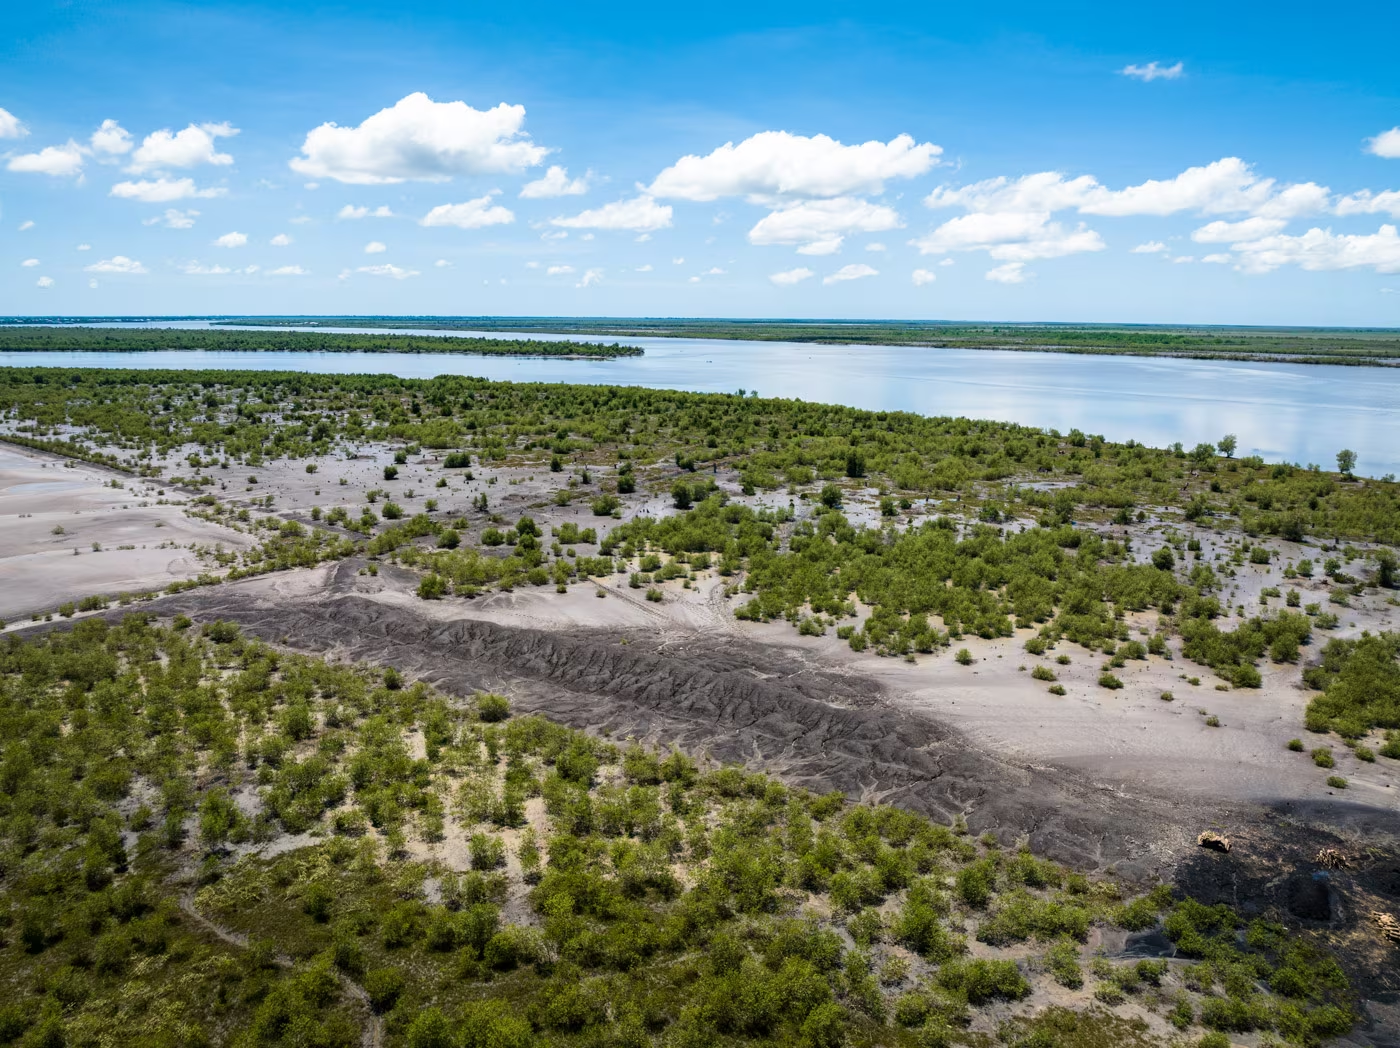
The State of the World’s Mangroves in 2024
Introduction
This article provides a detailed review of the report The State of the World’s Mangroves 2024, published by the Global Mangrove Alliance (GMA). Mangroves, ecosystems bridging land and sea, are vital for biodiversity, climate resilience, and human livelihoods. Despite their importance, they face mounting threats from climate change and human activities. The GMA report highlights key advances in mapping and protecting mangroves while addressing ongoing challenges and outlining future strategies.
Updated Overview of Mangroves Worldwide
Improved mapping techniques in 2024 have provided a more precise assessment of the extent and distribution of mangroves globally. While the first global maps of mangrove forests were generated in 1997, the fourth iteration of the Global Mangrove Watch (GMW v4.0), released in 2024, employs 10-meter resolution mapping, a sixfold improvement over previous versions, with an accuracy rate of 95.3%. This dataset maps 14 million hectares (147,256 km²) of mangroves worldwide, spanning 128 countries.
Key regional insights:
• Southeast Asia leads with 33.6% of the global mangrove area, with Indonesia alone hosting 21%.
• The Americas account for 27.8%, Africa 20.8%, and Oceania 10.9%.
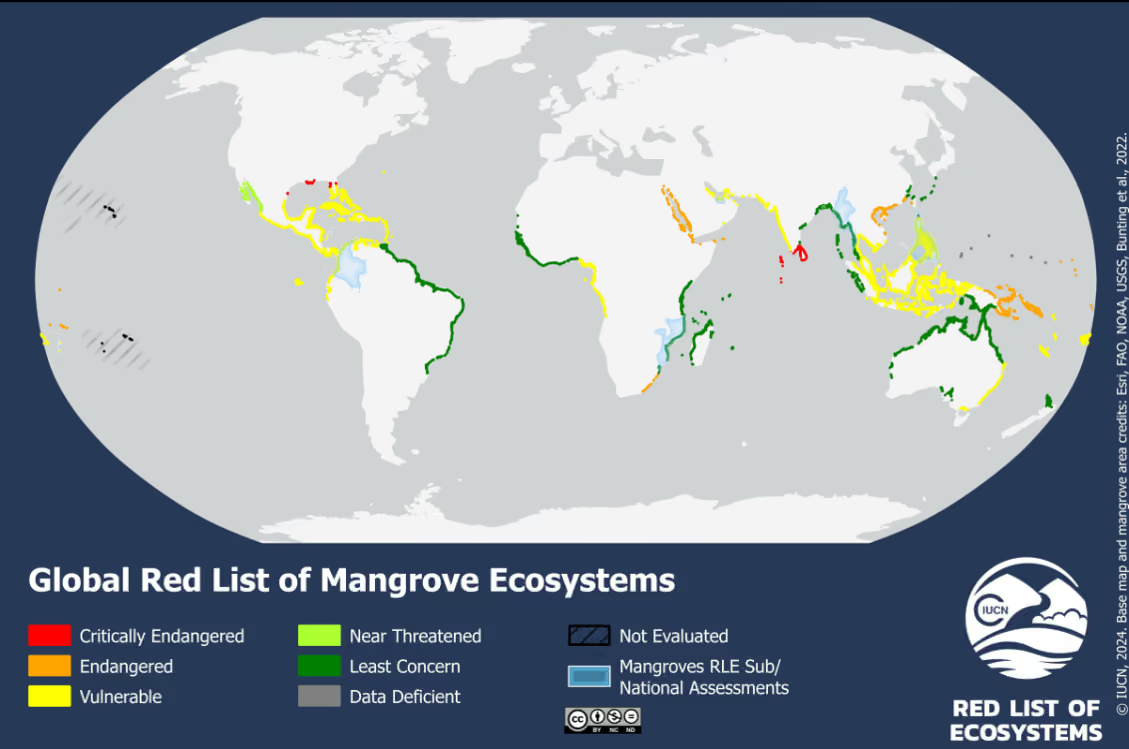
The international NGO International Union for Conservation of Nature (IUCN) has established a Global Red List of Mangrove Ecosystems, which identifies mangrove ecosystems at risk globally, and is depicted on the map below:
Key Drivers of Mangrove Loss
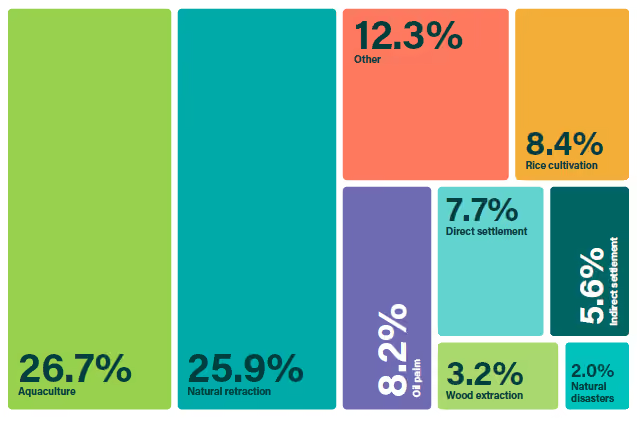
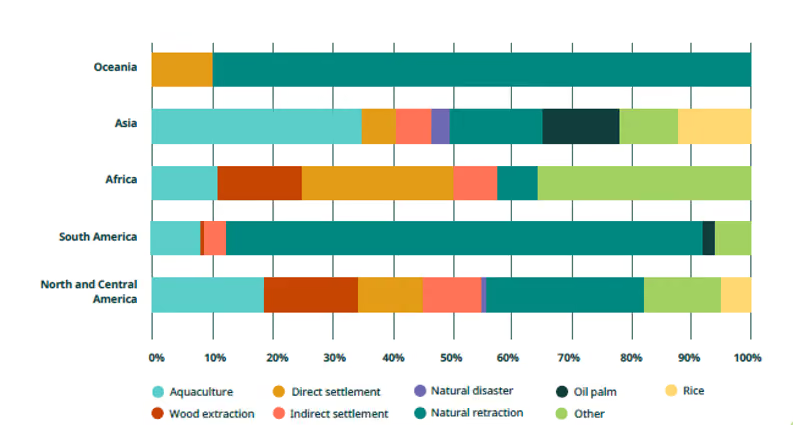
Human Activities (43% of global loss): Over the last twenty years, activities like aquaculture (26.7%), rice cultivation (8.4%) and oil palm plantations (8.2%) were major contributors to global mangrove losses.
Natural Retraction (26% of global loss): The term “natural retraction” is used to cover changes or losses of mangroves that are driven by movements in riverbeds, sediment inputs, or sea levels. Oceania experienced the most extensive natural retraction, accounting for 90% of its mangrove decline.
Trends Over Time:
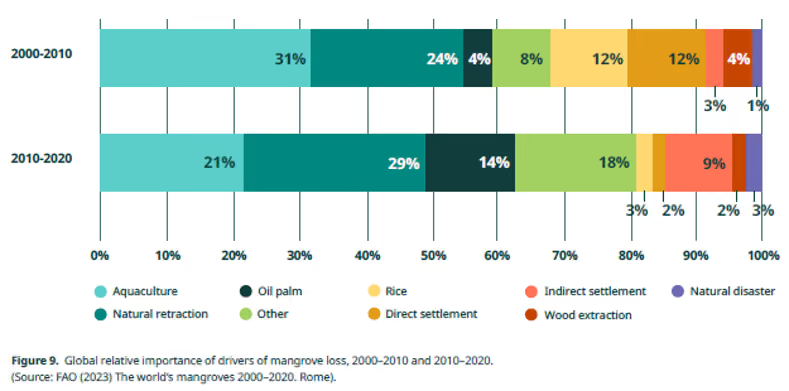
Comparing the two periods 2000-2010 and 2010-2020:
• Aquaculture remains a key driver, but its significance diminished, causing about 31% of loss in 2000–2010, compared to 21% in 2010–2020.
• The significance of rice cultivation and direct settlement (conversion to buildings and infrastructure) as drivers of mangrove loss also declined markedly (from 24% to 5%).
• On the other hand, conversion to oil palm plantations became a substantially bigger driver (causing about 4% loss in 2000–2010, but 14% in 2010–2020).
• Natural retraction’s contribution rose from 24% to 29%, partly due to intensified climate change impacts.
Regional Variations:
• Human-induced activities dominate in Asia (aquaculture, rice, oil palm) and Africa (direct settlements, agricultural activities, aquaculture), highlighting local socio-economic pressures.
• Natural threats are prevalent in South America and Oceania.
Expansion of Mangroves
Despite losses, more than half of the total mangrove decline (6,769 km²) between 2000 and 2020 was offset by mangrove expansion, resulting in a net decline of “only” 2,839 km².
• Natural expansion accounted for 82% of global gains, showcasing mangroves’ natural resilience to environmental changes. Given the increasing impacts of climate change, it might be expected that natural retraction would outpace natural expansion. It is actually the opposite, and natural expansion greatly exceeded mangrove loss due to natural retraction. It illustrates the difficulty of predicting the effects of climate change on mangrove communities given the complex interplay between local biophysical conditions and the consequences of global warming.
• Restoration efforts contributed 18% of the gains, with significant success in Southeast Asia (25%) and Africa (33%).
Utility of Mangroves
Carbon Storage:
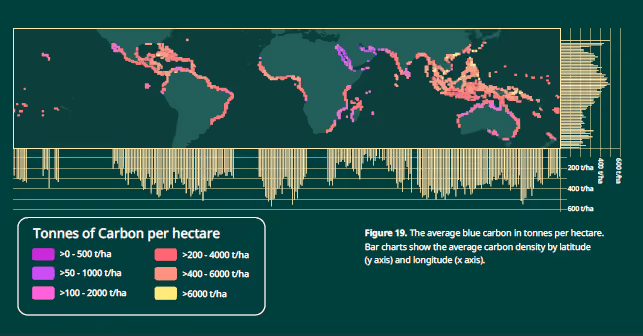
• Mangroves store an average of 394 tonnes of carbon per hectare, with 78% in soil, 15% in aboveground biomass, and 7% in belowground biomass.
• There is considerable variation across regions: Southeast Asia, particularly the Philippines, has the highest carbon densities (above 650 tonnes/ha), while the Middle East has the lowest (below 100 tonnes/ha). The differences are illustrated in the map below:
Coastal Protection:
• Mangroves reduce flood depth by 15-20%. Their dense root systems dissipate wave energy, safeguarding coastal communities from flooding and erosion.
Biodiversity:
• Mangroves are home to 70 species of mangrove trees, among which the most well-known are Avicennia, Bruguiera, Ceriops, Rhizophora and Sonneratia, with 16% under elevated threat of extinction.
• Worldwide, a significant number of species are endemic to mangroves, including 48 birds, 14 reptiles, one amphibian, and six mammals. 40% of these are threatened with extinction.
• Indian mangroves in the Sundurbans have the highest record of biodiversity, supporting over 5,700 plant and animal species.
Food Security:
• Mangroves support nearly 800 billion young fish, prawns, and crabs annually. Across the world, millions of people rely on the protein and micronutrients provided by mangrove coastal fisheries.
• Beyond fisheries, mangroves offer resources like honey, fruits, medicinal plants, livestock fodder, fuelwood and charcoal, contributing to diverse livelihoods in coastal regions.
• Shrimp ponds have deforested huge surface of mangroves in the 1970s. A 2018 study estimated that there are 250,000 ha of abandoned shrimp ponds in Indonesia alone. The challenges of returning shrimp ponds to mangroves can be significant, but groups such as the Mangrove Action Project have developed highly effective approaches.
Conservation and Restoration Efforts
Guidelines and Best Practices:
In 2023, the GMA and the Blue Carbon Initiative launched the Best Practice Guidelines for Mangrove Restoration. The Guidelines were developed to provide project managers, investors, and policymakers with a step-by-step approach for every phase of the project cycle, from project design and funding to implementation. The guidelines emphasize for example on the following restoration best practice:
• Understand the ecosystem services of mangroves. Within the coastal zone, mangroves form a complex mosaic with adjacent ecosystems, such as tidal marshes, seagrass meadows, tidal flats, and coral reefs. As such, it is often difficult to fully determine where one ecosystem starts and another ends. Many efforts at mangrove restoration have been misguidedly placed in some of these adjacent ecosystems, notably on tidal flats and shallow seagrass systems, where tidal flooding prevents the natural establishment of mangrove trees. Such efforts are often unsuccessful with low survival rates of seedlings, and they can also damage these valuable adjacent ecosystems. Mangrove conservation and restoration activities need to ensure that ecosystems adjacent to mangroves are incorporated into projects. This will require thinking more holistically about conserving multiple ecosystems and their connectivity across the seascape.
• Connect with Local Ecological Knowledge and traditional knowledge of Indigenous groups.
• Focus on Integrated mangrove aquaculture (IMA): IMA involves the restoration of mangroves within ponds and embankments of farms. In fact, IMA or Sustainable Aquaculture in Mangrove Ecosystems (SAIME) is the aquatic version of agroforestry on land, where food is grown and harvested within a functional ecosystem. Depending on the site conditions and the overall setup of the ponds and hydraulic dynamics, IMA ideally involves the restoration of at least 50% of the total surface of a given farm with mangroves. The trees become the main driver for productivity, generating seafood for harvesting, while creating economic incentives for farmers to restore and maintain mangroves. IMA usually involves a polyculture approach where farmers grow multiple species of shrimp, crab, filter-feeding fish, and bivalve mollusks.
Protection Goals:
• The GMA aims to double mangrove protection by 2030. Currently, 40% of mangroves are in protected areas. While countries like Brazil, Mexico, and Bangladesh protect over 75% of their mangroves, Malaysia and Papua New Guinea protect less than 5%.
Conferences and Financing Initiatives:
• At COP28, global commitments targeted restoring 15 million hectares of mangroves by 2030, with sustainable financing of US$4 billion through the Mangrove Breakthrough initiative.
• The 2025 COP 30 will convene in November 2025 in Brazil, with nature and IPLCs (Indigenous peoples and local communities) high on the agenda. The GMA, with partners of the Mangrove Breakthrough, plans to promote the key role of mangroves for climate action by leveraging its expansive network and expertise in advocating for mangrove conservation and restoration and garnering enhanced climate pledges.
Conclusion
The State of the World’s Mangroves 2024 report underscores significant progress in mangrove conservation while highlighting ongoing challenges. Mangroves are indispensable for global climate resilience, biodiversity, and livelihoods. However, there remains untapped potential for mangrove carbon projects to generate carbon credits.
At Removall, we are committed to restoring and conserving mangroves. We have already invested in large-scale projects, including a 5,000-hectare restoration initiative in the Zambezi Delta, Zambézia region, Mozambique, which follows the VERRA standard with dual CCB certification under the VM0033 mangrove methodology. Additionally, we are supporting a conservation project in Myanmar, also certified under VERRA standard, aimed at protecting and enhancing the region’s mangrove ecosystems. Beyond these efforts, we are actively developing new mangrove projects in other countries, including Tanzania and India, to further scale up our impact on blue carbon conservation and restoration.

Integrity requirements are intensifying in the voluntary carbon market
Introduction
The year 2025 continues the trend observed in recent years: the voluntary carbon market is moving toward greater integrity. Whether regarding projects, retirements, investments, or long term contracts, integrity is strengthening across all dimensions. This documented evolution is encouraging for a market whose long term viability depends on buyers’ confidence in the credibility of carbon credits.
The latter is based on two inseparable dimensions:
– Impact integrity: assessing whether projects genuinely reduce or avoid emissions relative to a robust baseline scenario.
– Implementation integrity: ensuring environmental and social safeguards, as well as broader contributions to sustainable development.
This transition, however, brings structural shifts that actors must navigate. In its latest report on the state of integrity of the VCM , MSCI Carbon Markets provides an in depth assessment from which several key insights emerge.
The VCM continues its path toward higher integrity
1. The integrity of new projects entering the market is increasing significantly
MSCI notes a marked improvement in the quality of new projects. Among projects currently under development, 37% are rated between AAA and A, compared with only 10% among projects already available on the market. When including BBB rated projects, the share of high quality new projects rises to 77%, compared with 26% across the existing market.
MSCI attributes this increase in integrity to several factors. First, there has been a shift in the distribution of new projects, with a rise in higher-quality project types, such as nature-based solutions (NBS). In addition, MSCI notes changes in project design that improve their quality, such as new reforestation projects (ARR), where more than half now include native species in their development, thereby improving the climate resilience of the projects. New clean cookstove projects are also seeing a marked improvement in their integrity due to greater methodological rigor. New projects incorporate more conservative values for their fNRB , which can be explained in particular by the arrival of new methodologies such as Verra’s VM0047 and VM0050, which reinforce calculation requirements. In order to ensure the highest standards of integrity, Removall is gradually transitioning its cookstove projects to the latest methodologies, including VM0050.
The article also highlights the major contribution to market integrity made by structural initiatives such as the Core Carbon Principles (CCPs) of the Integrity Council for the Voluntary Carbon Market (ICVCM) and the Carbon Offsetting and Reduction Scheme for International Aviation (CORSIA).
The ICVCM, an independent initiative bringing together more than 250 organizations, aims to strengthen market integrity by evaluating the standards and robustness of the methodologies used by these standards. To date, several methodologies proposed by recognized standards such as Verra and Gold Standard, particularly in the renewable energy sector, have been deemed non-compliant with CCP requirements. The CCPs are based on ten criteria covering governance, sustainable development, and the quality of emissions reductions. Among these, additionality plays a central role in the assessment.
For its part, CORSIA, the carbon offset mechanism led by the International Civil Aviation Organization (ICAO), will require airlines to purchase carbon credits to offset emissions growth above 85% of their 2019 levels starting in January 2028. By excluding renewable energy projects larger than 15 MW and certain improved cookstove methodologies, CORSIA also contributes to raising the quality requirements for projects wishing to be eligible. The effect of these two frameworks is already visible in the market: available and compliant projects are of significantly higher average quality than the market as a whole. MSCI also points out that no CCP-aligned project assessed to date has received the lowest rating, CCC.
2. Withdrawals and offtakes on the market are increasingly directed towards high-quality projects
In line with Removall’s observations among its clients’ requests, the report emphasizes that buyers are increasingly turning to high-quality credits. Withdrawal trends observed in the first half of 2025 show a consolidation in the share of credits from projects rated BBB or higher. This has stabilized at around 30%, which is higher than the average for the previous four years and the low of 18% recorded in 2020. Conversely, the proportion of withdrawals associated with a CCC rating was only 11%, its lowest level since 2019 and less than half of what was observed in 2022.
This increase in quality is also evident in offtakes, which benefit directly from the growing integrity of projects under development, as mentioned in the previous section. Together, these trends are an encouraging sign for future demand: they show that a growing number of players believe it is possible to lend credibility to their carbon contribution efforts by favoring credits from high-quality projects.
The rise in integrity is transforming the VCM: supply tensions rising prices, and new risks to anticipate
This dual increase in integrity, which is evident in both projects and procurement, is causing tensions that are reshaping the market in several ways.
1. The current level of supply of high-quality credits on the market raises questions about its ability to meet future demand, highlighting the importance of securing purchases through multi-year agreements from the project design phase onwards.
In the first half of 2025, long-term purchase agreements (offtake agreements) multiplied. Usually reserved for technological solutions, the number of off-takes for nature-based projects has more than doubled over the last twelve months, rising from 22 to 56. This trend highlights the challenge of securing access to high-quality credits. The scenario of an undersized supply is made more plausible with the publication of the latest draft of the SBTi’s Corporate Net Zero Standard, which is expected to require large companies subscribing to the initiative to finance emissions sequestration activities from 2035 onwards. With several offtakes already secured on behalf of its clients, Removall has solid expertise in this field, enabling it to provide the best possible support to companies wishing to commit to such an approach.
2. The prices of credits from high-quality projects are on the rise
This is the main consequence of the market’s increased integrity: high-quality credits are selling at increasingly high prices. Spot prices for projects rated BBB or higher are now above $7 on average across all categories, compared with $5 a year ago (November 2024). By comparison, spot prices for projects rated below BBB have never been lower, at less than $2 across all categories. This rise in prices can be explained primarily by the increase in developers’ costs, due to more demanding updated methodologies. The rise of market initiatives, such as the ICVCM’s CCPs, CORSIA, and the expected arrival of credits from Article 6 of the Paris Agreement, all aimed at strengthening the quality of compatible projects, is also contributing to the trend. Finally, the rise in prices is accentuated by the growing desire of companies to secure their future supplies. This strategy reduces the volume of credits available on the market, putting additional pressure on current prices and potentially leading to temporary shortages for certain types of credits. However, MSCI’s analysis suggests that prices are likely to continue to rise in the coming years.
As the report explains, market prices are currently being driven down by the large number of credits issued under older methodologies. When the vintages of these credits become too old to be used under carbon contribution standards such as ISO14068 or SBTi, the market is likely to see a rise in prices, benefiting projects that use the most recent methodologies. Aware of this situation, Removall draws on its database, built up over many years, to enable its clients to secure their future contributions now at the best market prices.
3. With the increase in the share of offtakes in companies’ carbon credit portfolios, their risk of delivery default is increasing, particularly for technological solutions.
As some technologies are still in the early stages of deployment (TRL 3-6+) , such as Direct Air Carbon Capture and Sequestration (DACCS), delays in project implementation may occur. The risk is also present for NBS projects whose development is directly affected by the effects of climate change. To mitigate the delivery risk, Removall relies on its quality procedures to select its suppliers and invest in its own projects. The work carried out by Removall’s teams includes reputational analyses of partner developers, risk analyses for projects, financing feasibility studies for projects in which it invests, and the use of insurance to cover the risk of delivery to the customer.
Key lessons
The VCM has reinforced its shift towards integrity with initiatives such as the ICVCM and CORSIA CCPs leading the way.
Projects under development/coming to market are demonstrating increasing integrity, which is reflected in higher MSCI ratings.
The growing integrity of the carbon market represents an opportunity for companies that, by mastering market best practices, can now build credible carbon contributions with greater peace of mind.
Integrity is driving market changes that are encouraging companies to position themselves now to secure their supply of high-quality credits at competitive prices.
Removall, as an integrated company that is both an investor, developer, certifier, and intermediary, is in an excellent position to assist and draw conclusions from developments in the VCM. It is committed to putting its ICROA-recognized expertise at the service of those who wish to engage in a serious carbon contribution approach.
Source : https://www.msci.com/research-and-insights/paper/2025-state-of-integrity-in-the-global-carbon-credit-market
Sources
(1) 2025 State of Integrity in the Global Carbon Credit Market MSCI Carbon Markets, MSCI
(2) More information on MSCI rating methodology in appendix.
(3) fNRB refers to the fraction of non-renewable biomass used in the project. For cookstove projects, it is linked to the wood used as fuel to operate clean cooking stoves. fNRB is a key parameter for quantifying the number of carbon credits allowed by the project: the higher it is, the more emissions reductions the project generates.
(4) The vintage of a carbon credit corresponds to the year in which the emissions gains were achieved. Example: A credit with a vintage of 2021 means that the emissions reduction/sequestration occurred in 2021.
(5) The Technology Readiness Levels (TRL) framework, developed by NASA in the late 1970s, assesses technological maturity. TRL levels 3 to 6 correspond to an early stage, ranging from proof of concept to initial demonstrations in a relevant environment. It is now used as a standard reference by several institutions, including the EU.